
The outline below provides a general guide for setting up the design of a Mixed Lymphocyte Reaction. A series of pilot studies is often necessary to optimize the MLR responses for the cell type of interest. Examples of experiments that address some of these issues are presented on this page. These examples use an MLR which measures the proliferative response by an ELISA test for BrdU incorporation in the DNA of the proliferating cell.
The questions that may require investigation while designing a Mixed Lymphocyte Reaction include:
Mixed Lymphocyte Reaction Example Experiments:
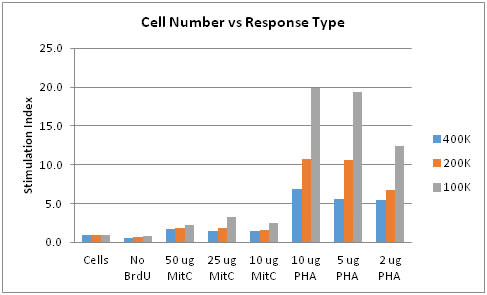
Chart 1 depicts an initial optimization experiment for a one-way MLR. This experiment is used to determine three things. First, the Mitomycin C concentrations required to render a stimulator cell non-proliferative so that it can be used in the one-way MLR. Second, the PHA concentration required for a T-cell proliferative response (this serves as the positive control for the MLR). Finally, the optimum number of responder cells to use.
Review of the results indicate that Mitomycin C concentrations in the range of 10 ug/mL to 50 ug/mL are fairly equivalent for all cell concentrations represented. Since a stimulation index (SI) of 1.0 or less is desirable for the Mitomycin C treated cells, additional assays may focus on varying incubation times with Mitomycin C or re-assaying the cells of interest for procedural evaluation to achieve an SI <1.0. The PHA data seem to indicate that there is no dose/response evident at 10/5/2 ug/mL for 400k cells. This may be due to PHA concentrations being too high, responder cell numbers being too high, or incubation time being too long. The difference in the 5 and 2 ug.mL PHA for the 200k and 100k cell numbers may indicate better cell number concentrations as well as a potential dose/response range to further assess as the experiment is optimized. The “No BrdU” indicates there is no excessive non-specific binding of the anti-BrdU antibody in the proliferation ELISA test.
Chart 1: Cell Number vs Response Type
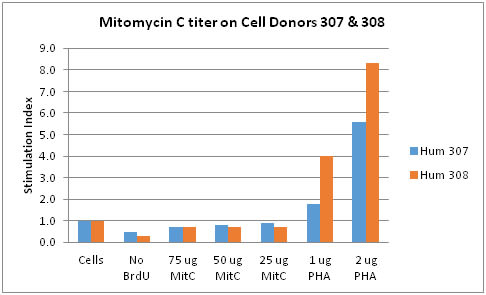
In another experiment (Chart 2), lymphocytes from two human donors to be used in a one-way MLR were evaluated for Mitomycin C treatment and for their response to PHA. Mitomycin C levels from 25 to 75 ug/mL proved effective in rendering the potential cells non-proliferative (SI < 1.0). Also, there was no interfering non-specific BrdU binding, and both cell types were responsive to PHA at both the 1.0 and 2.0 ug/mL levels.
Chart 2: Mitomycin C titer on Human Donor Cells
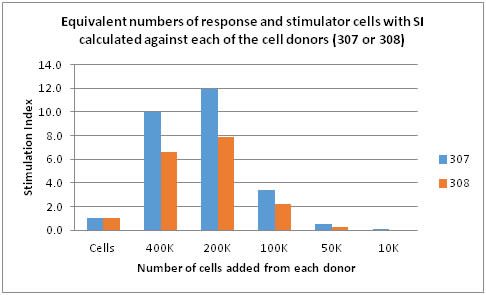
The next experiment (Chart 3) was designed to determine the total number of cells required for an allogeneic response to be used in further testing. Equivalent numbers of cells were added to each test well; 400K of each cell type (307 and 308) to yield 800K/well in a 96 well plate. The SI was calculated against the baseline (non-stimulated) cell for each cell type. Results indicate that the use of 400K cells may be too high a number to use as the response for 200K cells was higher. This may be due to over stimulation of cells at the 400K levels. It can also be seen that 100K cells provide an SI above baseline but both 50K and 10K do not provide sufficient cell numbers to elicit measureable allogeneic response in this system. Therefore, the optimal total number of cells may prove to be in the 200K to 100K range per donor in this system.
Chart 3: Cell Numbers vs Stimulation Index
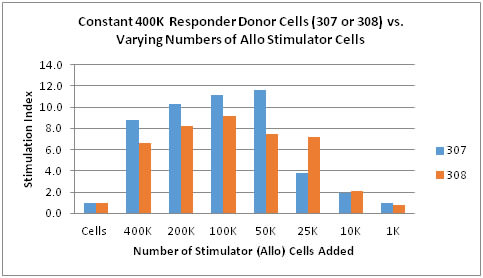
Finally, we look at the question of how many stimulator cells are required in a two-way MLR for an allogeneic response (Chart 4). In this experiment, the number of ‘responder cells’ was held constant while varying the number of ‘stimulator cells’. It should be noted that both cell types will proliferate and these terms are used only for ease of illustration. It can be seen that as the number of stimulator cells decrease, the SI increases. This trend is apparent up to about 50K to 100K of added stimulator cells, after which the SI tends to drop significantly. This information suggests that the total cell number is important and that to obtain an allogeneic response at least 425K – 450K total cells are required with at least 25K of stimulator cells. The response with 10K stimulator cells is rather weak and at 1K virtually indistinguishable from the non-stimulated baseline cells. This provides information for assay design to achieve maximal stimulation while averting over- and under-stimulation in developing an allogeneic response.
Chart 4: Number of Stimulator Cells vs Stimulation Index
These examples are from experiments run in 96 well plates with 7 day incubation times. All experiments are in-house studies used for assay optimization and are shared for educational purposes only.
Help us develop this page, and get your MLR question answered! Simply fill out the form below with your question, and give us some information on how to get back to you.
